How accurately can tomorrow’s hourly demand be forecast—and where does the model struggle?
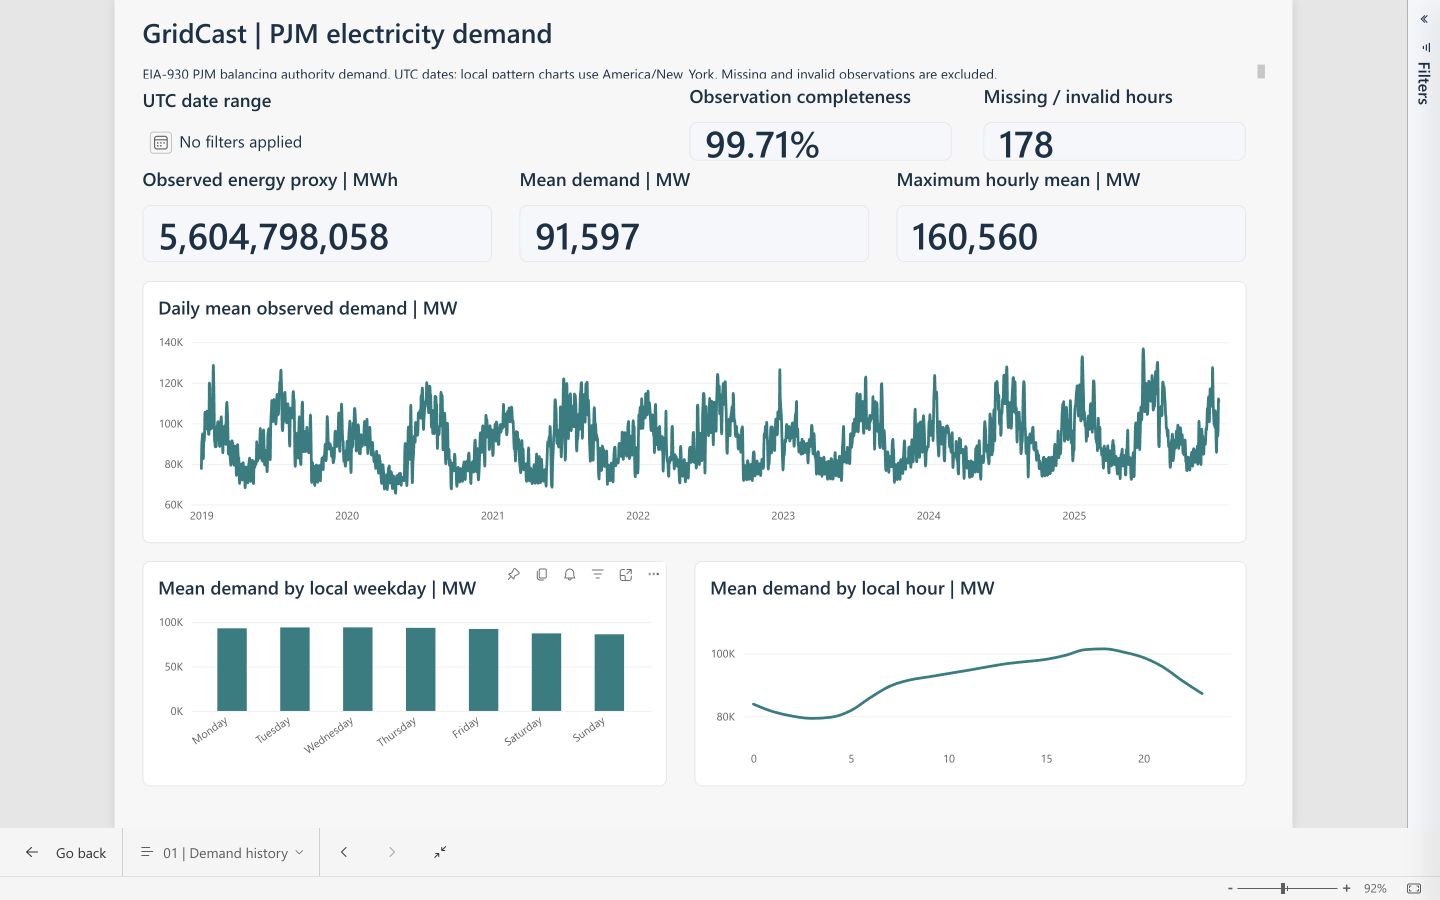
GridCast uses official EIA-930 PJM electricity-demand data from 2019–2025. The project audits 61,368 hourly slots, builds features from information available before the target day, and compares five forecasting models through chronological evaluation.
A four-page Power BI Service report connects demand history, model comparison, error diagnostics, and a historical next-day illustration. Public screenshots and source files let readers inspect the work without a Power BI account.
Forecasting result
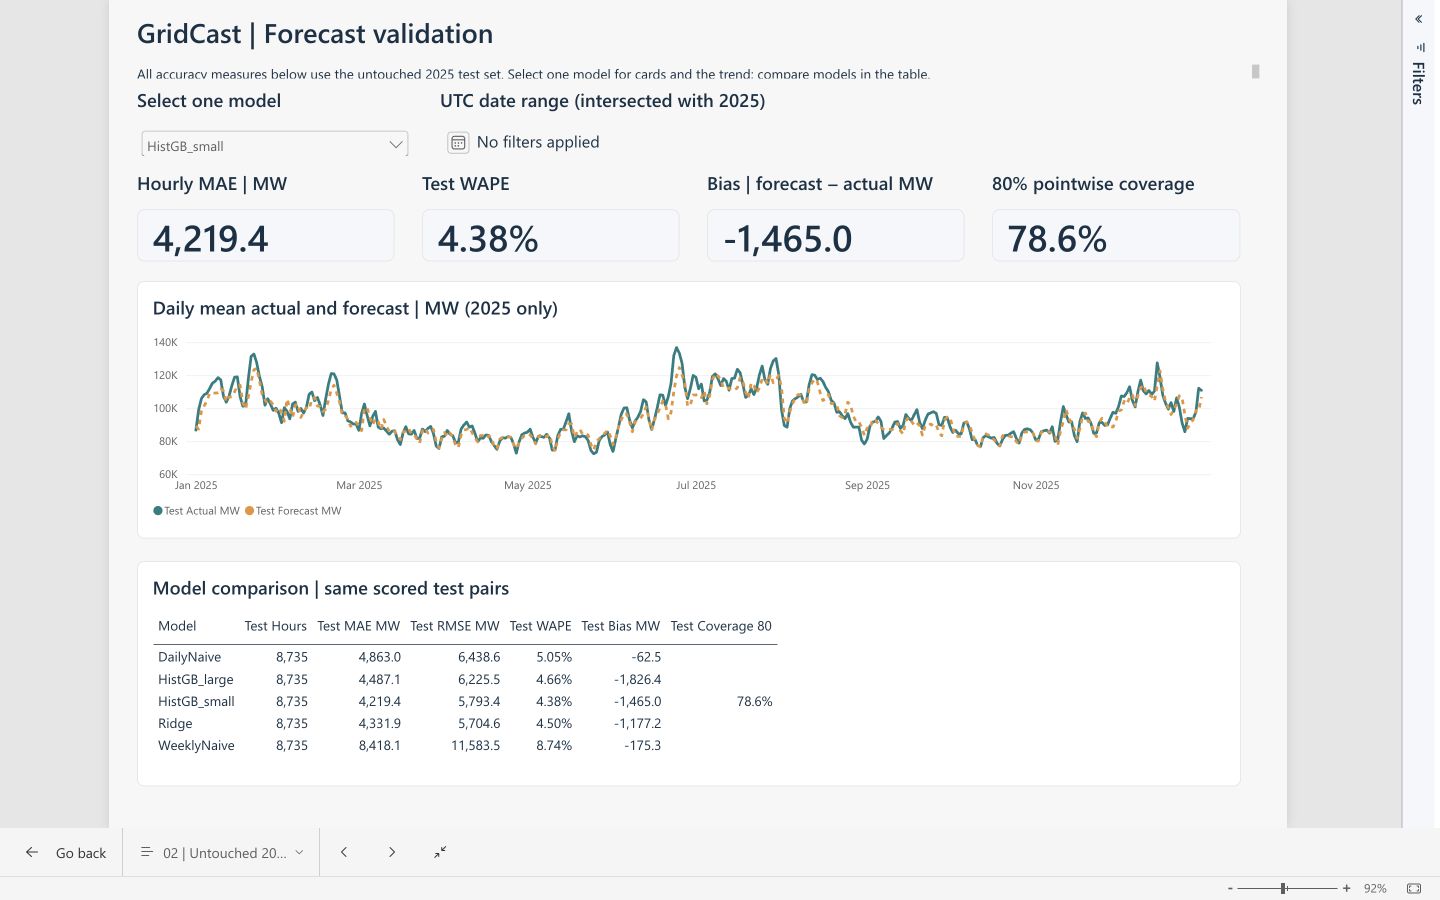
The selected model achieved 4.38% WAPE and 4,219 MW MAE on 8,735 valid held-out 2025 hours, improving MAE by 13.2% over yesterday’s same-hour baseline.
Power BI implementation
Four report pages, 35 visuals, and 28 persistent DAX measures. Refresh, model/date filters, and numerical results were verified in Power BI Service.
Practical interpretation
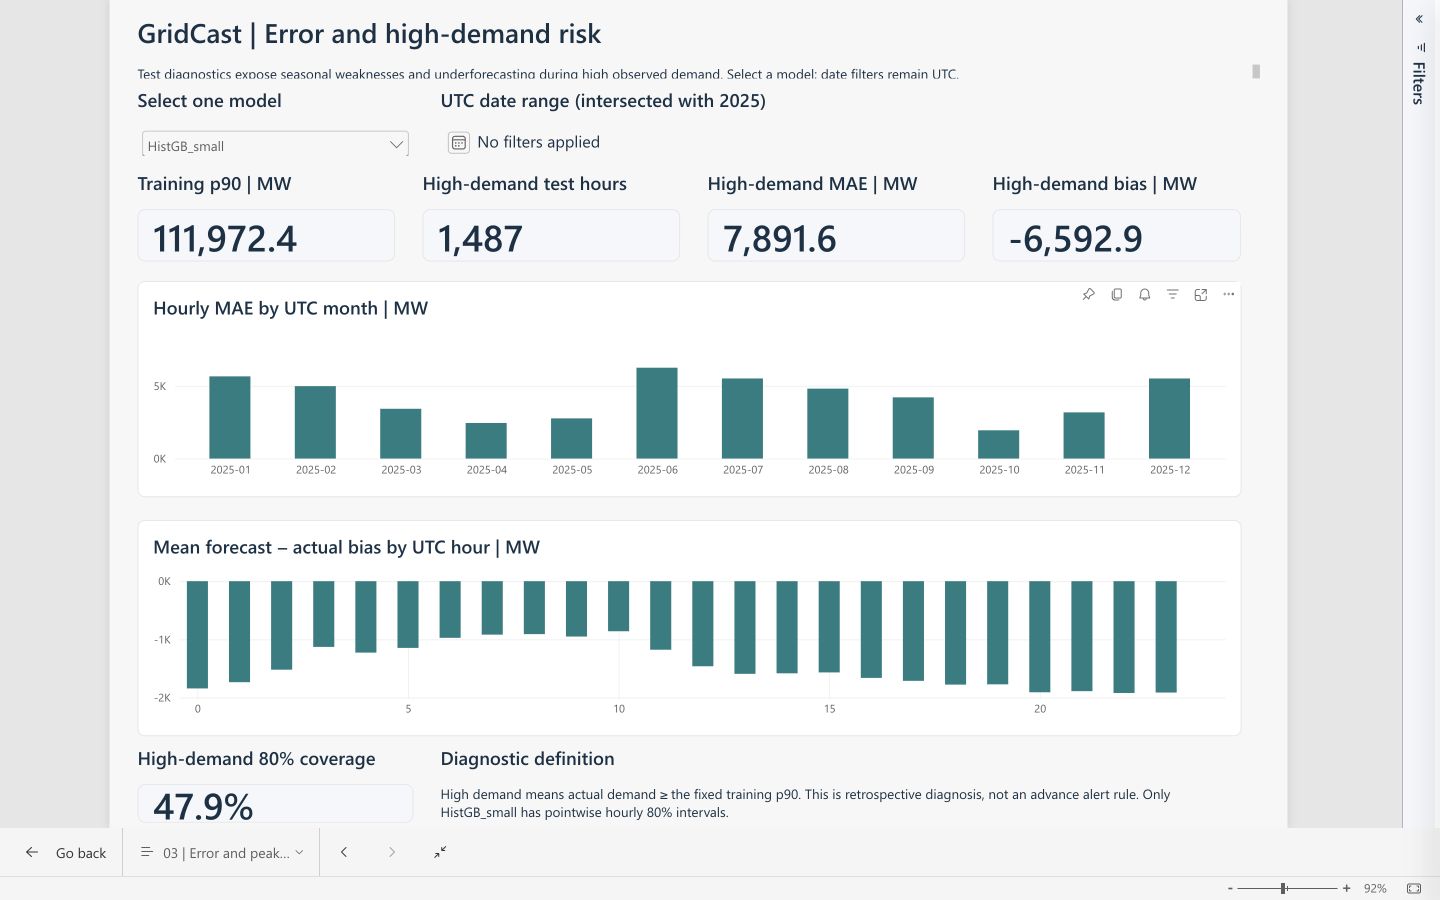
Errors increase during high demand. The completed study explains that tradeoff instead of treating aggregate accuracy as sufficient for operational use.
4.38%TEST WAPEWeighted absolute percentage error
13.2%LOWER MAE VS. DAILY BASELINEIdentical 8,735 scored 2025 hours
28 measuresDAX IN POWER BI SERVICE4 pages · 35 visuals · 4 canonical tables
Power BI report & supported findings
Make model performance easy to inspect.
Forecast validation in Power BI Service.One-model cards and a shared-axis actual/forecast chart support detailed comparison. The table retains all five models; observed model and UTC date filters update the report.
Histogram gradient boosting was selected using 2023 validation MAE, fitted through 2023, and given prediction intervals calibrated on 2024. The untouched 2025 test remained separate. Ridge achieved lower test RMSE, so model choice is presented as a tradeoff between metrics.
High demand exposes an important weakness.Nominal 80% intervals covered 78.6% overall, falling to 47.95% during high-demand hours. Mean high-demand bias was approximately −6,593 MW.
These diagnostics show where further investigation is needed before using forecasts in a live setting. The project measures retrospective forecast performance; it does not claim operational deployment or realized cost savings.
Power BI skills & analytical workflow
Connect reliable data to useful report behavior.
Prepare and model the data
Audit source timestamps and invalid targets, preserve provenance, and keep missing actuals distinct from feature-input replacements. Power Query prepares FactDemand, FactForecast, DimDate, and DimModel, with three canonical fact-to-dimension relationships.
Define consistent DAX measures
Implement accuracy, bias, coverage, history, and completeness measures. Check persistent engine results against independent Python calculations across five models and twelve filter contexts, including blank/zero behavior.
Design and verify the report
Build four pages with consistent number formats, chronological sorting, shared demand axes, readable tables, and model/date filtering. Verify a completed Service refresh, saved report, reopened pages, and genuine rendered screenshots.
Make the study reproducible
Publish the pinned source extract, Python pipeline, executed notebook, model card, case study, and scoped validation receipts. Hosted CI and retained anonymous-access checks support public review of the release.
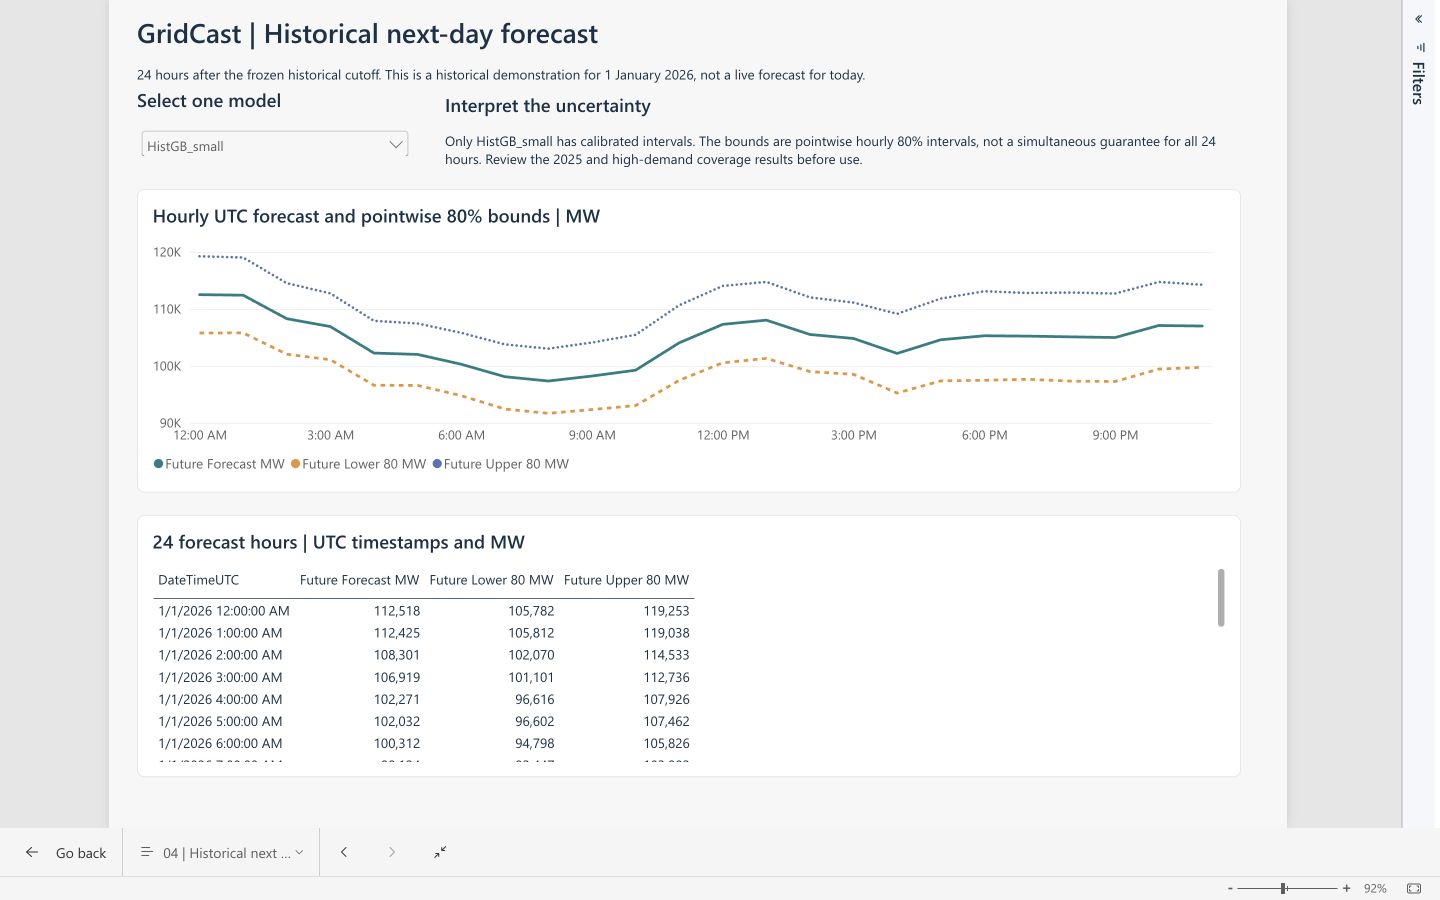
View the other two Power BI pagesDemand history.Observed demand, completeness, and calendar patterns establish context for the forecast.Historical next day.A 24-hour illustration for January 1, 2026 UTC; future actuals remain blank.Project scope and verification boundaries
The historical study and Power BI Service implementation are completed and publicly documented. The interactive Service report remains private; the images shown here are genuine saved Service screenshots. Windows Desktop/PBIP compatibility and PBIX export were not established. Revised historical data and reporting latency also limit claims about real-time availability.
Source: official U.S. Energy Information Administration EIA-930 data, retrieved October 27, 2026. This is an independent portfolio project without EIA or PJM endorsement.